
There are dozens of stock analysis tools, but only a handful are genuinely free and genuinely useful. The short answer: Intrinsiqq for valuation and quality scoring, Finviz for screening, Stock Analysis for clean financials, and TradingView for price charts. Below is a full comparison of the best free tools across the metrics that matter, plus a fair look at what each does well and where it falls short, so you can stack the right ones instead of paying for an all-in-one.
The best free stock analysis tools, compared
| Tool | Best for | Quality score | DCF / valuation | Financials | Screener | Charts | Free tier |
|---|---|---|---|---|---|---|---|
| Intrinsiqq | Valuation + quality | Yes (0-100) | Yes, 2-stage DCF | 10+ years | Yes | Fundamental | Full, no account |
| Finviz | Screening | No | No | Snapshot | Yes (strong) | Price | Good (ads) |
| Stock Analysis | Financial statements | No | No | 5 yrs free (10 Pro) | Yes | Price (basic) | Generous |
| TradingView | Charts + technicals | No | No | Some | Yes | Price (best) | Good |
| Simply Wall St | Visual snapshots | Visual grade | Yes (gated) | Limited | Yes | Visual | Limited views |
| Yahoo Finance | Quotes + news | No | No | Basic | Basic | Price (basic) | Good (ads) |
Pick by the job you need done
Valuation and quality (is this a good business at a fair price?)
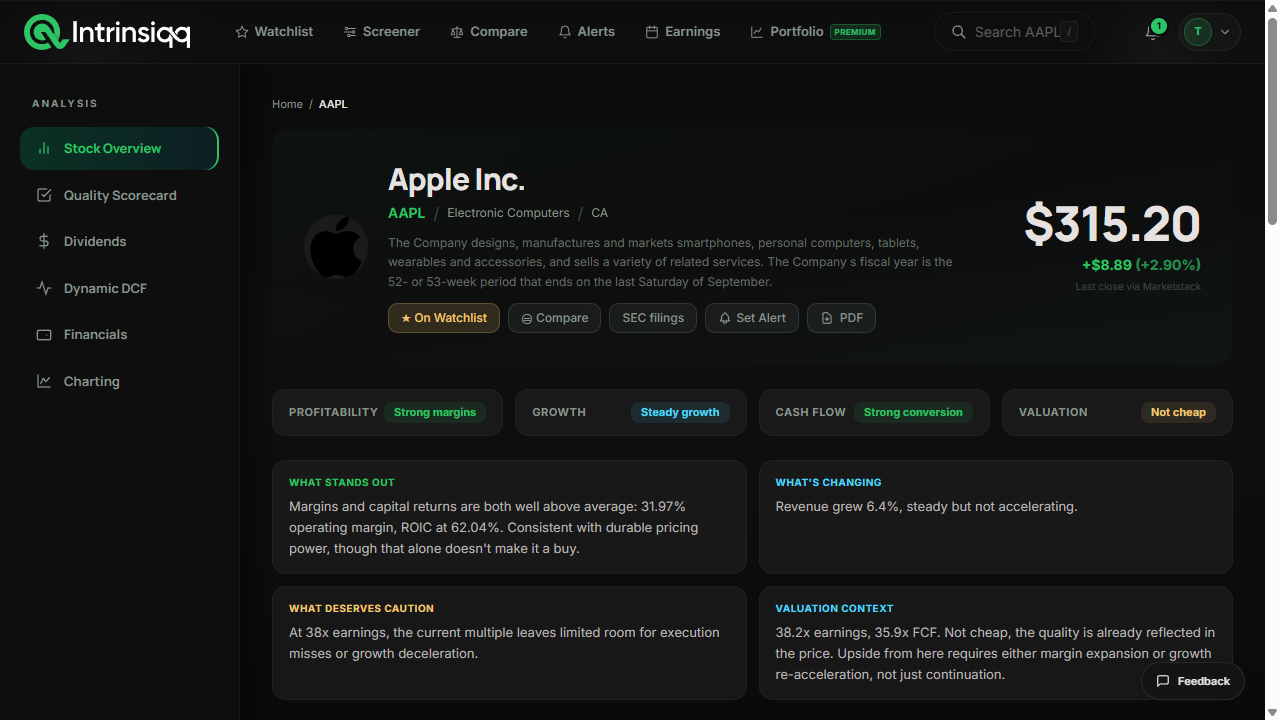
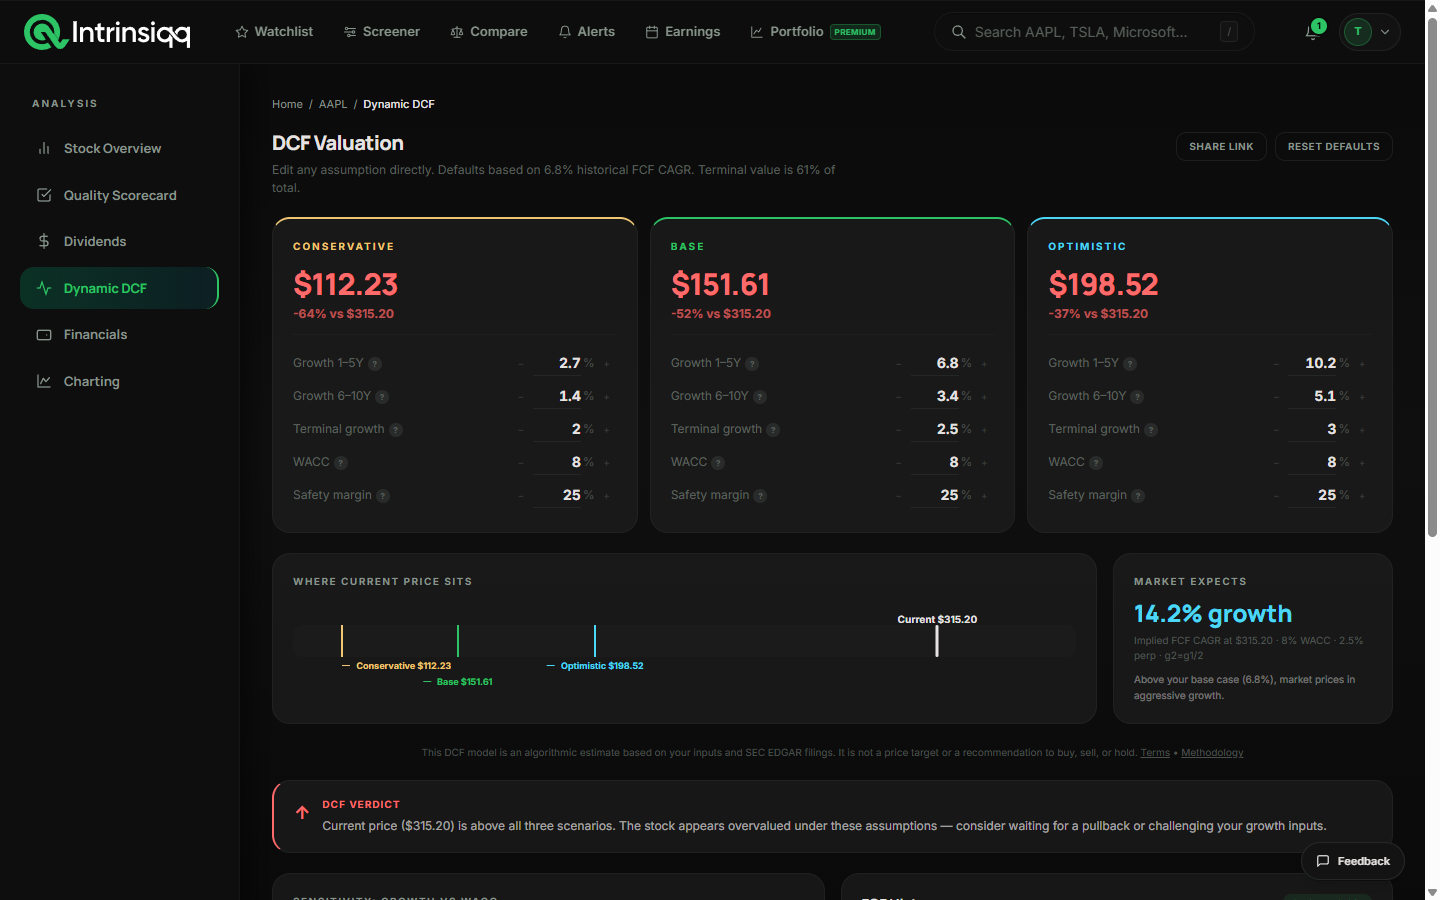
This is where Intrinsiqq focuses. Open any stock and you get a documented quality score, a two-stage DCF fair value you can adjust, dividend safety, and 10+ years of financials, all computed from SEC EDGAR and free with no account. It answers the "is it overvalued?" question directly rather than handing you a wall of ratios.
Strengths
- +Free quality score + adjustable DCF, no account
- +Dividend safety + 10+ years of SEC-sourced financials
- +Advanced fundamental charting: plot any metric over a decade, free
- +Transparent, documented method
Limitations
- ×US-listed companies only
- ×No technical price charts or indicators (it charts fundamentals)
- ×End-of-day prices
Screening (find stocks that match criteria)
Finviz is the classic free screener: fast, broad, with a market heatmap and news. Intrinsiqq also has a screener focused on quality, value, and dividend filters if you want to screen on the same SEC-sourced metrics you analyze with.
Strengths
- +Dozens of filters (~67), very fast
- +Market heatmap and news for top-down scanning
- +No account needed
Limitations
- ×Shallow per-company fundamentals
- ×No valuation or quality scoring
- ×Real-time data and backtesting are paid
Financial statements (just show me the numbers)
Stock Analysis has clean, free multi-year statements and ratios. Intrinsiqq does too, sourced straight from 10-K and 10-Q filings, so the figures match what companies reported to regulators.
Price charts and technicals (price action and indicators)
TradingView is the standard for price charting on a free tier, with the deepest indicator library and a large community of scripts. That is a different job from fundamental charting (below), so most investors pair it with one of the tools above rather than choosing between them.
Strengths
- +Best-in-class price charts and technical indicators, free tier
- +Huge community of custom scripts and ideas
- +Multi-asset (stocks, crypto, forex)
Limitations
- ×Raw fundamentals only: no DCF or quality verdict
- ×Advanced features and extra layouts are paid
- ×Not built to answer 'is this a good business?'
Fundamental charts (the financials over time)
A second, very different kind of charting matters more for long-term investors: plotting the fundamentals over time rather than the price. This is where Intrinsiqq is unusually strong for a free tool. Its fundamental chartinglets you put any metric (revenue, margins, free cash flow, ROIC, debt, buybacks, dividends) on a chart across up to a decade, switch between bars, lines, stacked, and combo views, and recast the same data as year-over-year growth, indexed to a base year, or as a share of the total. You can overlay a stock's own historical P/E, P/S, P/FCF, or EV/EBITDA on top of the fundamental it is priced against, and break revenue down by business segment, geography, or product. It is the kind of fundamental charting paid platforms like Koyfin and Fiscal.ai are built around, and on Intrinsiqq it is free with a no-cost account.
Strengths
- +Plot any fundamental over 10+ years: bars, lines, stacked, or combo
- +Overlay historical P/E, P/S, P/FCF, or EV/EBITDA on the financials
- +Segment revenue by business line, geography, or product, free
Limitations
- ×Fundamental, not price/technical charting (no candlesticks or indicators)
- ×Requires a free account (the only gated part of the product)
- ×Annual and quarterly periods, end-of-day data
Start with the valuation read
Quality score, DCF fair value, and 10+ years of SEC-sourced financials on any US stock, free.
Analyze MSFT freeThe free stack most investors actually need
- Intrinsiqq for the valuation and quality verdict.
- Finviz for screening the universe down to candidates.
- Stock Analysis for an extra look at the raw statements.
- TradingView if you also care about entry timing.
That covers most of what paid all-in-one platforms charge for, at $0. Pay only when a specific paid feature clearly earns its cost.