
A stock is overvalued when its price is higher than what the underlying business is worth. The practical way to tell is to compare the price to three things: the company's own history, its peers, and an estimate of its intrinsic value from a discounted cash flow (DCF) model. No single number is proof, but when several point the same way, you have a defensible read. Here is how to do it, step by step.
1. Check the valuation multiples
Multiples put the price in context by comparing it to something fundamental, earnings, cash flow, sales, or operating profit. Each tells you something slightly different, which is why it pays to look at more than one:
| Multiple | Price compared to | When it looks expensive |
|---|---|---|
| P/E | Accounting earnings per share | High vs the company's own range, its sector, and its growth |
| P/FCF | Free cash flow | High; often more reliable than P/E since cash is harder to massage |
| P/S | Revenue per share | High when the company is unprofitable and priced for future growth |
| EV/EBITDA | Operating earnings, including debt | High; useful for comparing companies with different debt loads |
| PEG | P/E relative to growth rate | Above ~1.5-2 can signal you are paying too much for the growth |
The single most important habit is to compare three ways: against the company's own 5-year range, against its closest peers, and against the broad market. A stock can look cheap on one comparison and expensive on another, and the disagreement is where the real question lives.
The easiest way to do the first comparison is to chart the multiple over time. On Intrinsiqq you can overlay a stock's historical P/E, P/S, or P/FCFon the earnings, sales, or cash flow it is priced against, over up to a decade, so you can see at a glance whether today's multiple sits high, low, or mid-range versus the company's own history rather than guessing.
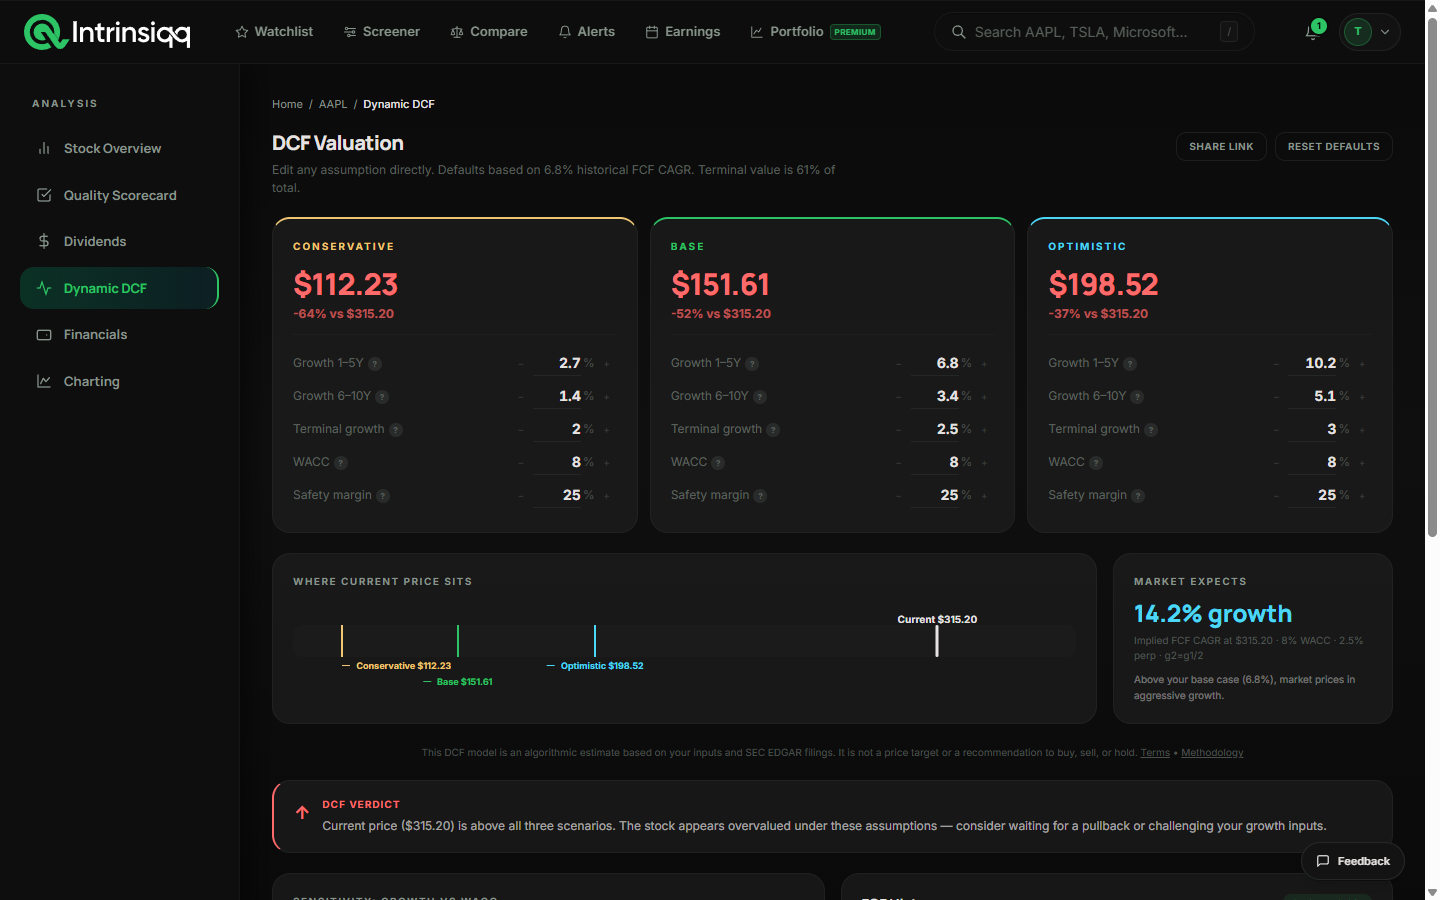
2. Estimate intrinsic value with a DCF
Multiples tell you what the market is paying. A discounted cash flow model estimates what the business is actually worth by projecting its future free cash flow and discounting it back to today. If the current price is well above that intrinsic value, the stock may be overvalued; if it is below, it may be undervalued. The key inputs are the growth rate, the discount rate (WACC), and the terminal growth rate, and small changes matter, so it is worth running bull, base, and bear cases rather than trusting one number.
On Intrinsiqq, every stock has a two-stage DCF with sliders so you can test your own assumptions and see the implied fair value and margin of safety instantly.
3. Put it in context with quality
Valuation only means something relative to quality. A cheap-looking stock with shrinking revenue, rising debt, and falling margins may be a value trap, not a bargain. A pricier stock that compounds free cash flow at a high return on invested capital can still be reasonably valued. Always read the valuation alongside a quality assessment: growth, margins, share count, debt, and returns on capital. The two questions, "is it cheap?" and "is it good?", only make sense together.
Check if a stock is overvalued, free
See the P/E, P/FCF, a two-stage DCF fair value, and a quality score on any US stock, sourced from SEC filings.
Check AAPL nowA quick overvaluation checklist
- Is the P/E and P/FCF high versus the company's own 5-year range?
- Is it expensive versus close peers and the market?
- Is the price above a reasonable DCF intrinsic value (base case)?
- Does the price require growth that looks unrealistic?
- Is the quality strong enough to justify a premium, or not?
If several answers point to "expensive," the stock is probably overvalued at today's price. If they conflict, you have found the real debate, which is exactly where doing your own analysis pays off.