Guide7 min read

How to Tell If a Company Is High Quality

The Intrinsiqq Team
SEC-data stock analysis · May 26, 2026 · Updated June 3, 2026
Guide
Intrinsiqq

A high-quality company is one that earns strong returns on the money it invests, grows, and can sustain both without piling on debt or diluting shareholders. You can judge quality from a handful of fundamentals: growth, margins, returns on capital, the balance sheet, and the share count. Here is what to look for, the healthy sign for each, and how the Intrinsiqq quality score combines them into one 0-100 number.

The fundamentals that signal quality

No single metric makes a company high quality; you are looking for a pattern across several. These are the checks that matter most and the healthy sign for each:

CheckWhat it rewardsHealthy sign
Revenue growth (5Y)A growing top lineCompound growth above ~10%
Free cash flow growth (5Y)Growth showing up in real cashFCF compounding, not just revenue
Operating margin trend (3Y)Pricing power and disciplineMargins flat to expanding
Return on invested capitalTurning capital into profitConsistently high (roughly 15-20%+)
Capital structureBalance-sheet resilienceLow net debt vs free cash flow, or net cash
Share dilutionPer-share growth being realFlat or falling share count
P/E and P/FCFNot overpaying for itReasonable relative to the growth

The standouts are return on invested capital (ROIC), the single best quality signal, because a consistently high ROIC means the company turns invested money into strong profits, and free cash flow growth, because it confirms the growth is real cash, not just accounting revenue. A flat or falling share count matters more than people realise: steady dilution quietly erodes your stake even when the business is growing.

Quality and price are different questions. A wonderful business can still be a poor investment if you overpay, and a cheap stock with deteriorating fundamentals can be a value trap. Judge quality first, then valuation.

How Intrinsiqq scores quality

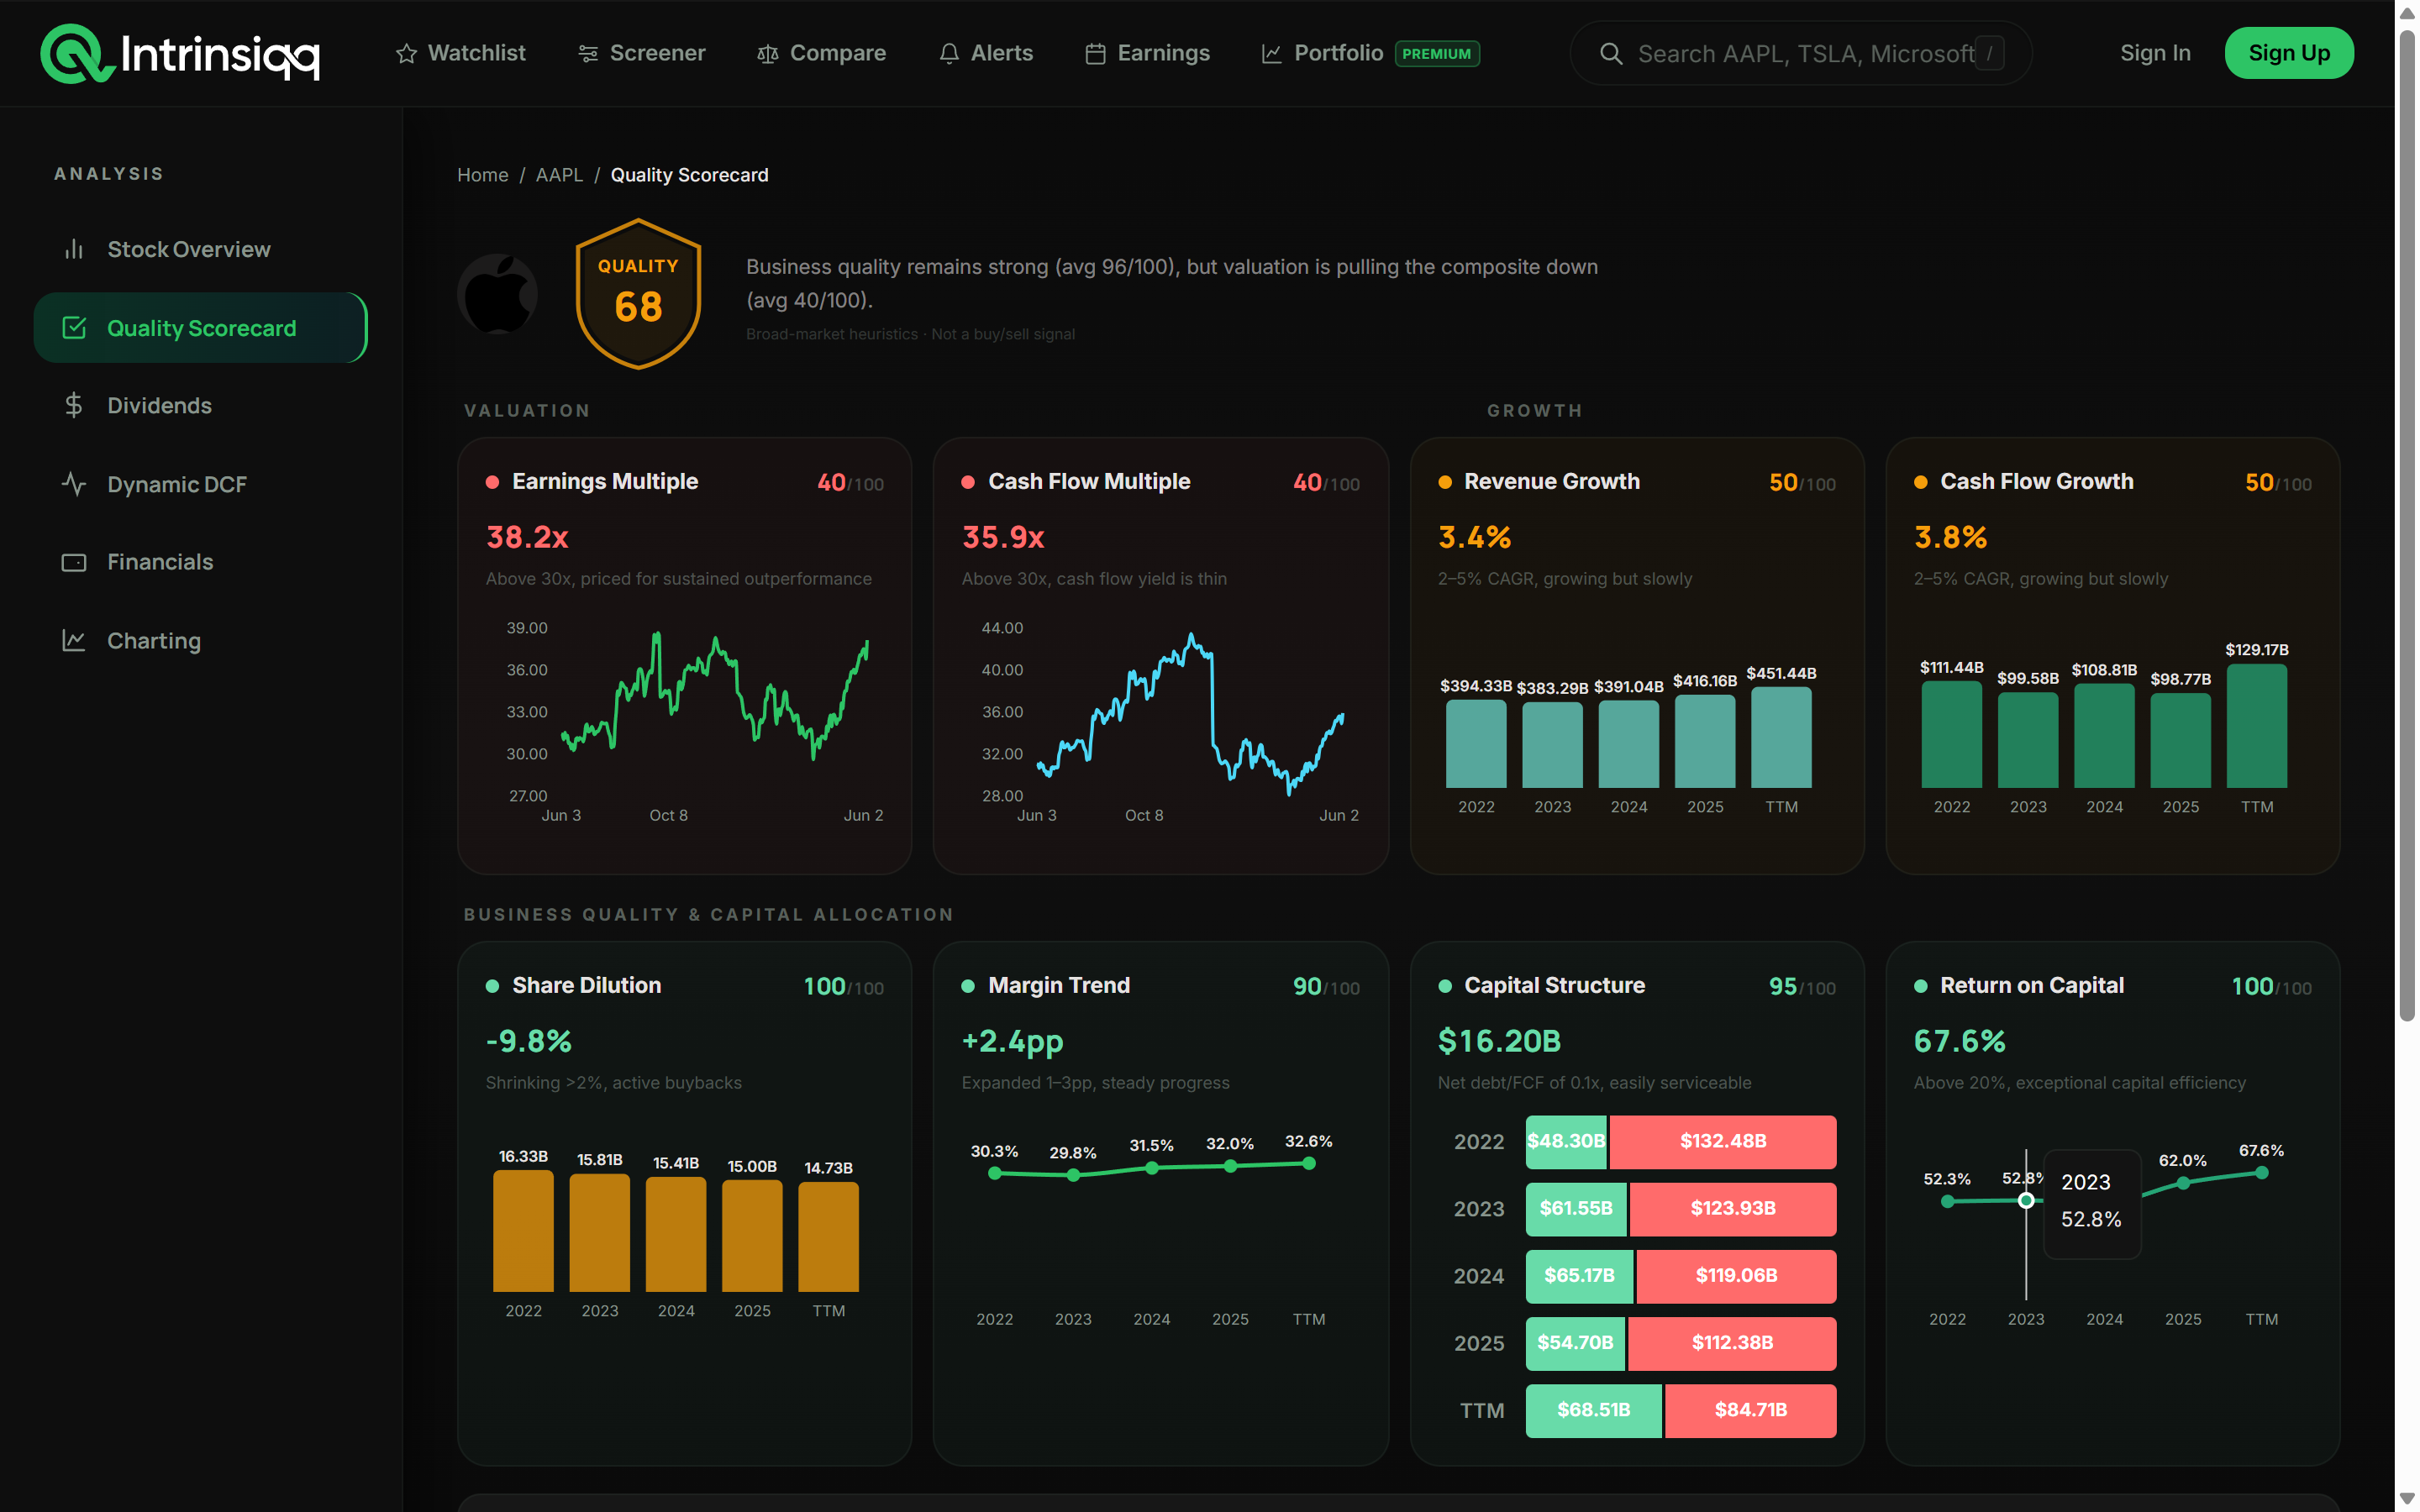
The Intrinsiqq quality score is a 0-100 weighted composite of eight checks: P/E, P/FCF, 5-year revenue growth, 5-year free cash flow growth, share dilution, 3-year margin expansion, capital structure, and ROIC. Each produces its own sub-score, and the weighting leans toward the cash-flow and returns measures that best separate durable businesses from fragile ones. Every input is computed from SEC EDGAR filings, so the picture reflects what the company actually reported, not estimates.

Intrinsiqq quality scorecard for Apple showing eight checks: earnings and cash-flow multiples, revenue and cash-flow growth, share dilution, margin trend, capital structure, and return on capital
The eight checks behind a quality score, each with its own sub-score and the underlying trend.

Because quality is a pattern over time, not a single snapshot, it helps to chart these fundamentals rather than read one year in isolation. Intrinsiqq's fundamental charting plots revenue and free cash flow growth, operating margins, ROIC, debt, and the share count over up to a decade, so you can see whether the trend is improving or quietly deteriorating, which is exactly what separates a durable business from a fragile one.

Check any company's quality, free

A 0-100 quality score from eight fundamental checks, computed from SEC filings.

Check MSFT's quality

Putting it together

Look for the pattern: durable growth, solid and improving margins, high returns on capital, a sound balance sheet, and no creeping dilution. When most of those line up, you are looking at a quality business, and then the only remaining question is whether it is fairly priced. A great business at a great price is the goal; a great business at any price, or a mediocre business at a discount, usually is not.

Frequently asked questions

How do you tell if a company is high quality?+

Look at the pattern across a handful of fundamentals rather than any single number: durable revenue and free cash flow growth (ideally compounding above ~10%), healthy and improving operating margins, a high return on invested capital (ROIC), a sound balance sheet with low net debt relative to cash flow, and a flat or falling share count so per-share growth is real. When most of these line up, the business is high quality. Return on invested capital is the most telling single signal, and free cash flow growth confirms the growth is real cash rather than just accounting revenue.

What is the best single indicator of business quality?+

Return on invested capital (ROIC) is the most telling single metric. A consistently high ROIC means the company turns the money it invests into strong profits, which is the hallmark of a durable, high-quality business with a real competitive advantage. A company that compounds capital at a high ROIC can grow without constantly raising money or diluting shareholders. That said, ROIC is most reliable read alongside free cash flow growth, margins, and the balance sheet, because a single year can be flattered by one-offs.

Does a high-quality company always make a good investment?+

No. Quality and price are separate questions. Even an excellent business can be a poor investment if you overpay, because the future growth is already priced in and there is little margin for error. Conversely, a cheap stock with deteriorating fundamentals can be a value trap rather than a bargain. The sensible order is to assess quality first, confirm the business is durable, and only then check whether the valuation is reasonable using multiples and a DCF.

What return on invested capital is considered good?+

As a rough guide, a return on invested capital consistently above roughly 15-20% is strong, and well above the company's cost of capital is what really matters, because that gap is where value is created. The key word is consistently: a single high year can come from a one-off, so look for a multi-year track record. Capital-light businesses (software, brands, networks) often post very high ROIC, while capital-intensive ones (utilities, heavy industry) run lower, so it is fairest to compare ROIC within an industry.

The Intrinsiqq TeamSEC-data stock analysis

Intrinsiqq builds free stock analysis from official SEC EDGAR filings: quality scores, DCF fair value, dividend safety, and 10 years of financials for 8,000+ US companies. Every number is computed from primary filings and documented in full on our methodology page, not from third-party estimates. Read the methodology →

Intrinsiqq is a research tool, not investment advice. Figures are computed from public SEC EDGAR filings; stock prices are delayed. Always do your own research before making any investment decision. Product names and logos are trademarks of their respective owners; Intrinsiqq is independent and not affiliated with or endorsed by them.

Related articles