

Simply Wall St is one of the most popular ways to research stocks visually, but most of its depth sits behind a subscription and a limited free allowance. The short answer if you want a genuinely free replacement: Intrinsiqq for valuation and quality scoring, Stock Analysis for clean financials, and Finviz for screening. Below is a detailed, no-paywall comparison of the best free Simply Wall St alternatives in 2026, with what each one actually does well and where it falls short.
What Simply Wall St does well
It helps to be fair about what you would be replacing. Simply Wall St built its reputation on a genuinely good idea: turn a company's fundamentals into a single visual "snowflake" across five areas (value, future, past, health, and dividend), so a beginner can grasp a business at a glance. It also includes a fair-value estimate based on a discounted cash flow, analyst forecasts, and clean, infographic-style report pages. For someone new to investing who wants a friendly visual summary, it is one of the most approachable tools available.
Where it falls short (and what to look for)
The catch is the freemium model. The free plan limits how many companies you can analyze in depth and gates the detail behind a paid subscription, and the snowflake, while approachable, can oversimplify a complex business into a shape. When you are choosing an alternative, the four things that actually matter are:
- How much is genuinely free, not "free trial" or a monthly view cap.
- Where the data comes from: figures straight from SEC filings match what companies reported to regulators.
- Whether it answers the real question: is this a good business (quality), and is it cheap enough (valuation)?
- Depth you can verify: a documented method beats a black-box grade.
The best free Simply Wall St alternatives, compared
| Tool | Quality score | DCF / fair value | Dividend analysis | Financials | Screener | Free tier |
|---|---|---|---|---|---|---|
| Intrinsiqq | Yes (0-100, 8 checks) | Yes, 2-stage DCF | Yes (safety + growth) | 10+ years | Yes | Full, no account |
| Simply Wall St | Visual grade | Yes (largely gated) | Yes | Limited on free | Yes | Limited views |
| Stock Analysis | No | No | Data only | 5 yrs free (10 Pro) | Yes | Generous |
| Finviz | No | No | Yield / payout | Snapshot | Yes (strong) | Good (ads) |
| Seeking Alpha | Quant grade (gated) | No | Yes (gated) | Yes (gated) | Yes | Mostly gated |
| Morningstar | Star rating (free) | Analyst fair value (gated) | Yes | Limited | Limited | Limited |
Each alternative in depth
Intrinsiqq, the free valuation and quality tool
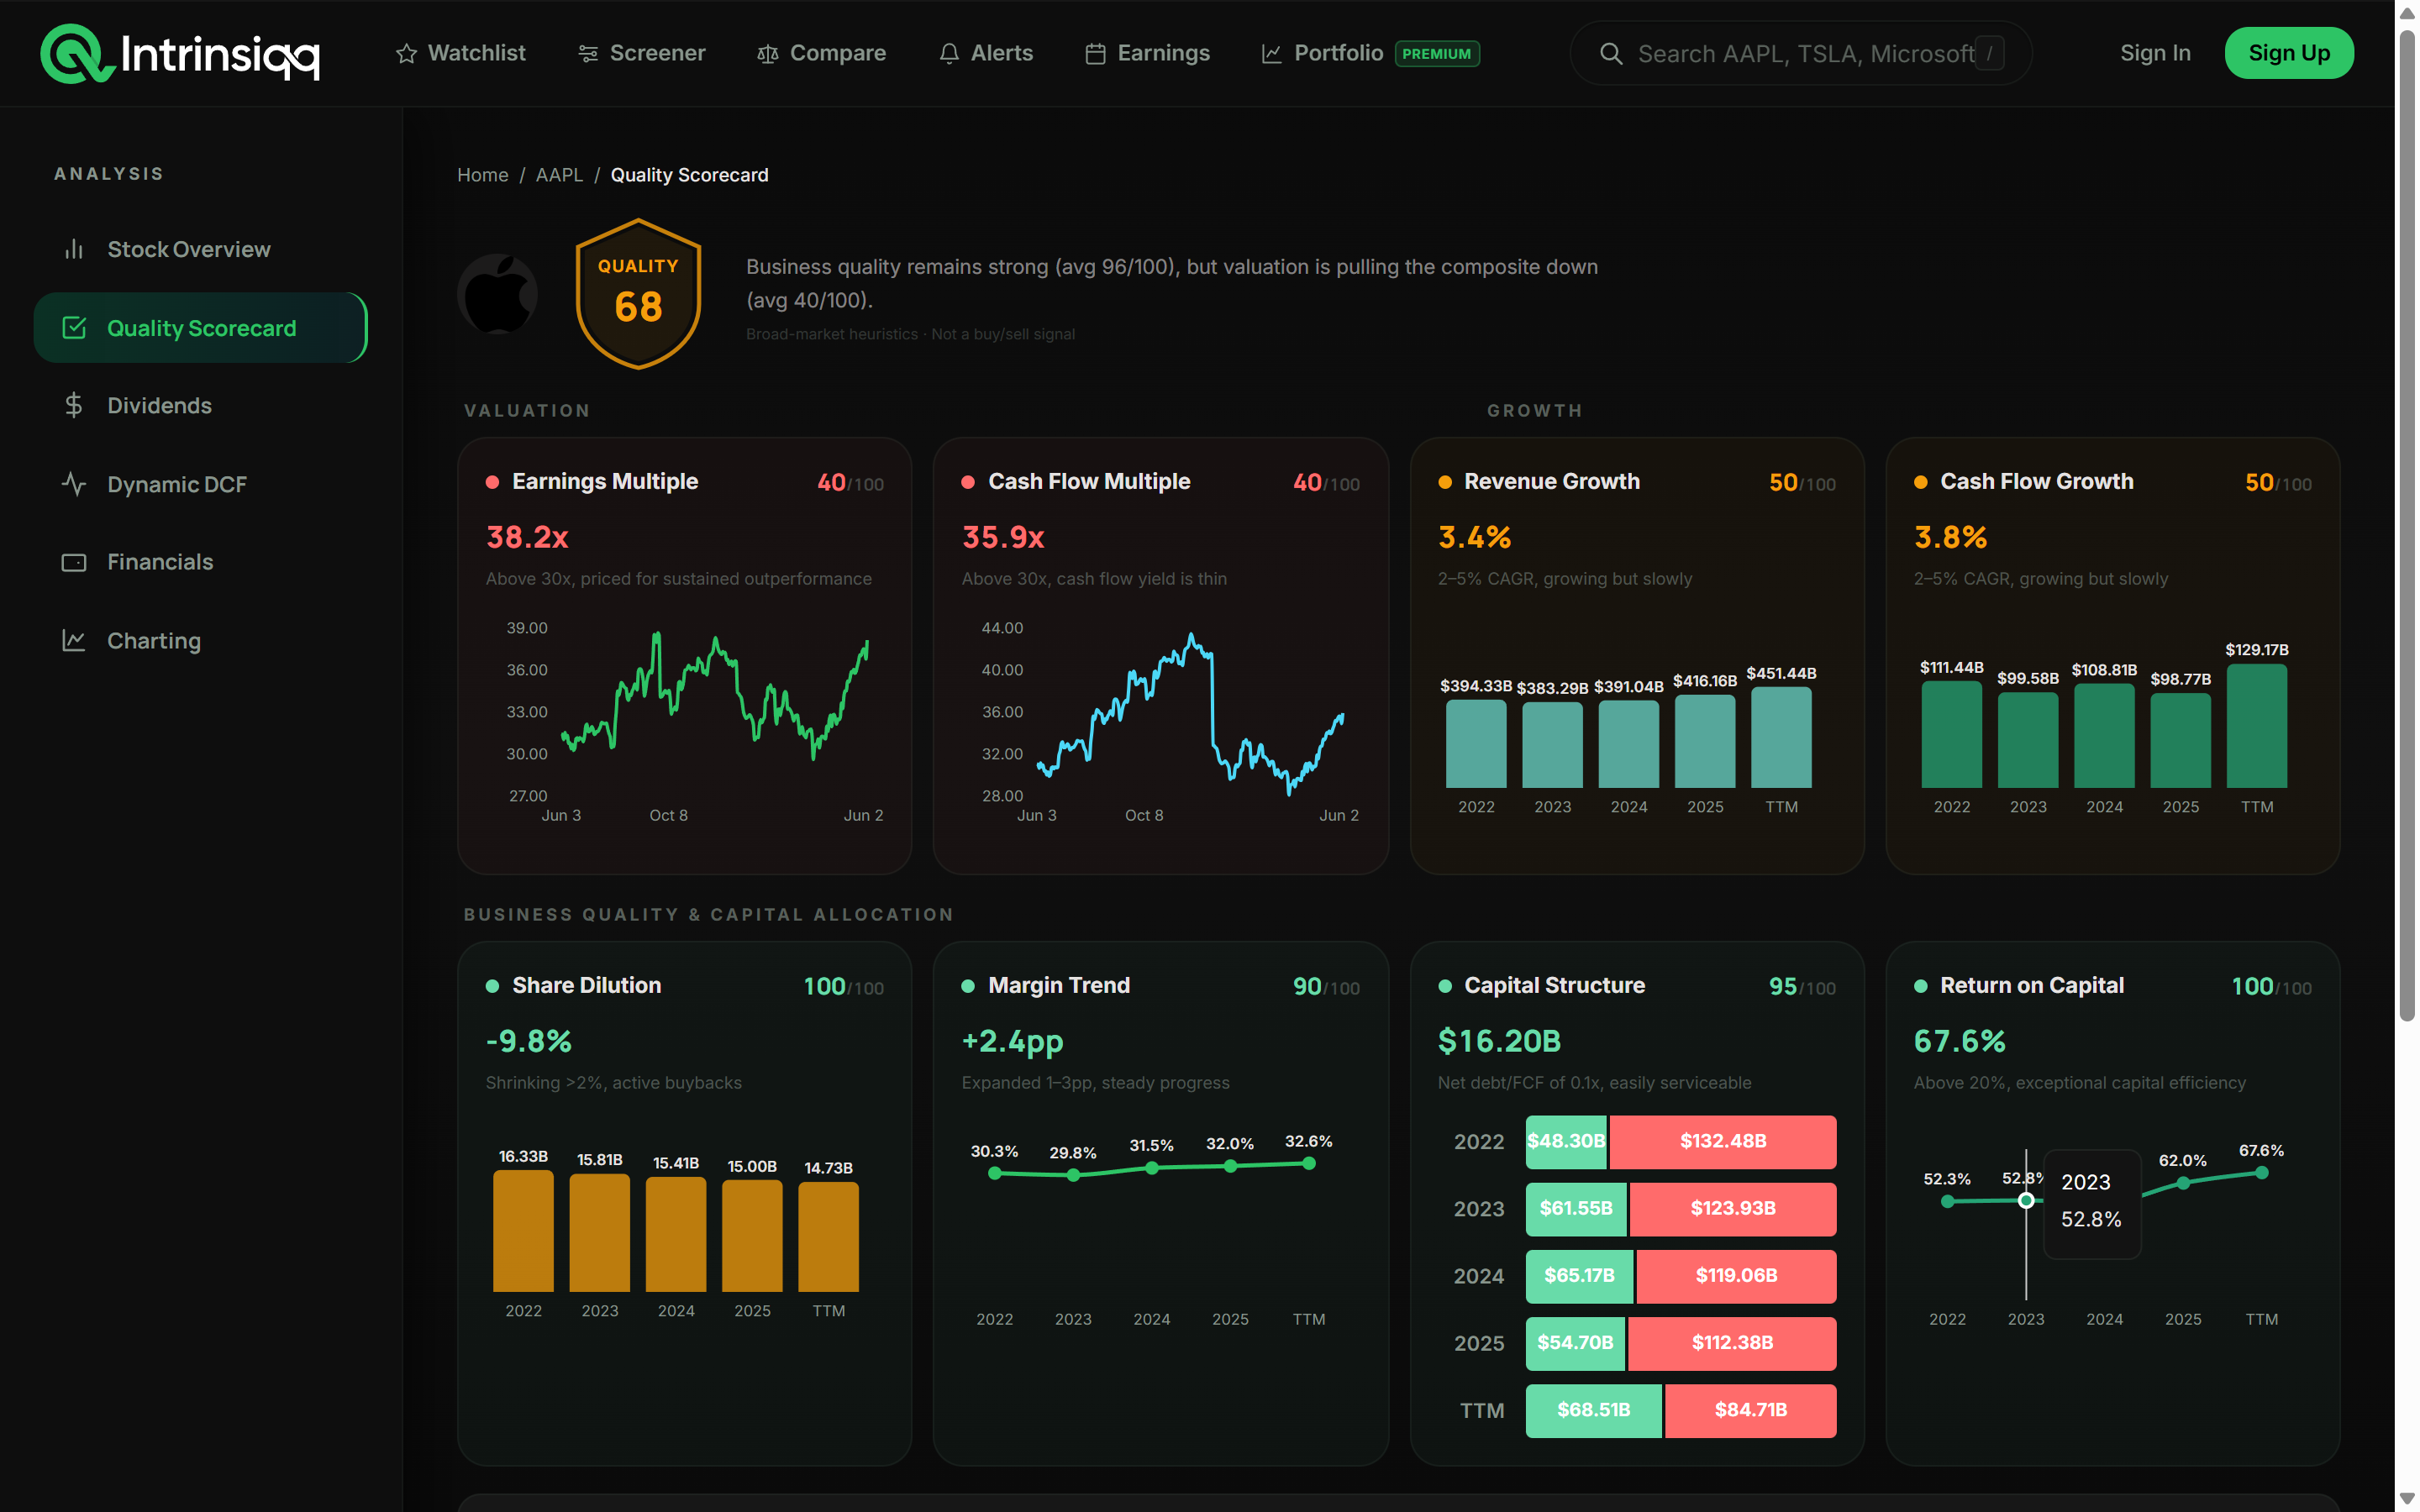
Intrinsiqq is the closest like-for-like replacement for the parts of Simply Wall St people actually use: the quality read and the valuation. Every stock page includes a documented quality score built from eight fundamental checks, a two-stage DCF fair value you can adjust across conservative, base, and optimistic cases, dividend safety, and 10 years of financials, all computed from SEC EDGAR filings and free with no account. Where Simply Wall St condenses a business into a single snowflake shape, Intrinsiqq also lets you chart the underlying fundamentals yourself: its fundamental chartingplots any metric (revenue, margins, free cash flow, ROIC, debt, dividends) over a decade, as bars, lines, or year-over-year growth, with the option to overlay the stock's historical P/E or P/FCF and to split revenue by segment.
Strengths
- +Genuinely free, no account needed, no paywall on the core analysis
- +Documented quality score + adjustable two-stage DCF (not a black box)
- +Advanced fundamental charting: plot any metric over a decade, free
- +Figures sourced directly from SEC EDGAR 10-K / 10-Q filings
Limitations
- ×US-listed companies only (filers with the SEC)
- ×No social/community layer or analyst forecasts
- ×Prices are end-of-day, not real-time
Stock Analysis, the clean free financials
Stock Analysis (stockanalysis.com) is the best free place to just read the numbers: clean multi-year income statements, balance sheets, and cash-flow statements, plus ratios and a usable screener. It is data-first rather than analysis-first, so it pairs well with a scoring tool rather than replacing one.
Strengths
- +Clean financial statements, about 5 years free (10 on Pro)
- +Fast company overview pages and a free screener
- +No account required to browse
Limitations
- ×No quality score or composite rating
- ×No discounted-cash-flow valuation model
- ×You interpret the numbers yourself
Finviz, the fast screener
Finviz is the classic free screener: dozens of filters, a famous market heatmap, news, and quick fundamental snapshots. It is built to find candidates across the whole market in seconds, not to value a single company deeply.
Strengths
- +Powerful, fast free screener and market heatmap
- +Good for top-down market and sector scanning
- +No account needed for the core screener
Limitations
- ×Shallow per-company fundamentals, no valuation model or quality score
- ×Real-time data and backtesting are paid (Finviz Elite)
- ×Dated interface and ad-supported free tier
Seeking Alpha, analysis and ratings
Seeking Alpha is strong for written analysis, community discussion, and its quant factor grades, but it is the most paywalled of the group: the quant ratings, author ratings, and most data tables sit behind Premium. It is more a complement than a free replacement.
Strengths
- +Large library of contributor analysis and earnings coverage
- +Quant factor grades summarise a stock quickly
- +Active community and news
Limitations
- ×Most ratings and data are behind a Premium subscription
- ×Contributor quality varies; articles are opinions
- ×No free valuation model
Morningstar, funds and analyst research
Morningstar is excellent for funds and ETFs and for its analyst-driven fair value and economic-moat ratings, but on the free tier most of the equity research and ratings are limited or gated.
See a free valuation and quality score on any stock
Quality score, two-stage DCF fair value, dividend safety, and 10+ years of SEC-sourced financials, no account.
Try it on AAPLHow to choose (and how to stack them)
For most retail investors the best free setup is not one tool but a small stack that mirrors the workflow Simply Wall St bundles into one paid app:
- Find candidates: Finviz or the Intrinsiqq screener.
- Judge quality and value: Intrinsiqq(the part that replaces Simply Wall St's snowflake and fair value).
- Read the raw statements: Stock Analysis or Intrinsiqq.
- Read opinions: Seeking Alpha, accepting the paywall.
If you want to go deeper on the two questions these tools exist to answer, see our guides on how to tell if a stock is overvalued and how to tell if a company is high quality.