

Most DCF calculators are either clunky spreadsheets you fill in by hand or locked behind a paid subscription. The short answer for a DCF calculator that pulls the financials for you and costs nothing to start: Intrinsiqq, which has a two-stage discounted cash flow built into every stock page, with adjustable assumptions and bull, base, and bear scenarios. The valuation is visible without signing up; editing the assumptions needs a free account, which comes with 14 days of full access. Here is a detailed look at the best free DCF calculators in 2026 and what each one does well. For the questions a DCF does not answer, retirement targets, fee drag, withdrawal rates, there are nine more free calculators here.
What a good DCF calculator needs
A DCF is only as good as its inputs and how easily you can test them. The things that actually matter:
- Auto-pulled financials: it should fetch the company's real free cash flow, debt, and share count for you, not make you type them in.
- Adjustable assumptions: growth rate, discount rate (WACC), and terminal growth, with instant recalculation.
- Scenarios: bull, base, and bear, because a single point estimate hides how sensitive the result is.
- A margin of safety: the gap between the intrinsic value and the current price, shown clearly.
The best free DCF calculators, compared
| Tool | Auto-pulls financials | Adjustable + scenarios | Margin of safety | Free DCF |
|---|---|---|---|---|
| Intrinsiqq | Yes (SEC EDGAR) | Yes, with sliders + 3 cases | Yes | Free account; 14-day full trial |
| Spreadsheet templates | No (manual entry) | Yes, if you build it | If you add it | Free |
| GuruFocus | Yes | Yes (adjustable) | Yes | Free calc; GF Value paid |
| Wisesheets | Yes (in Excel/Sheets) | Yes | If you build it | Paid (free trial) |
| Simply Wall St | Yes | Limited / gated | Yes | Limited views |
The options in depth
Intrinsiqq, the built-in DCF
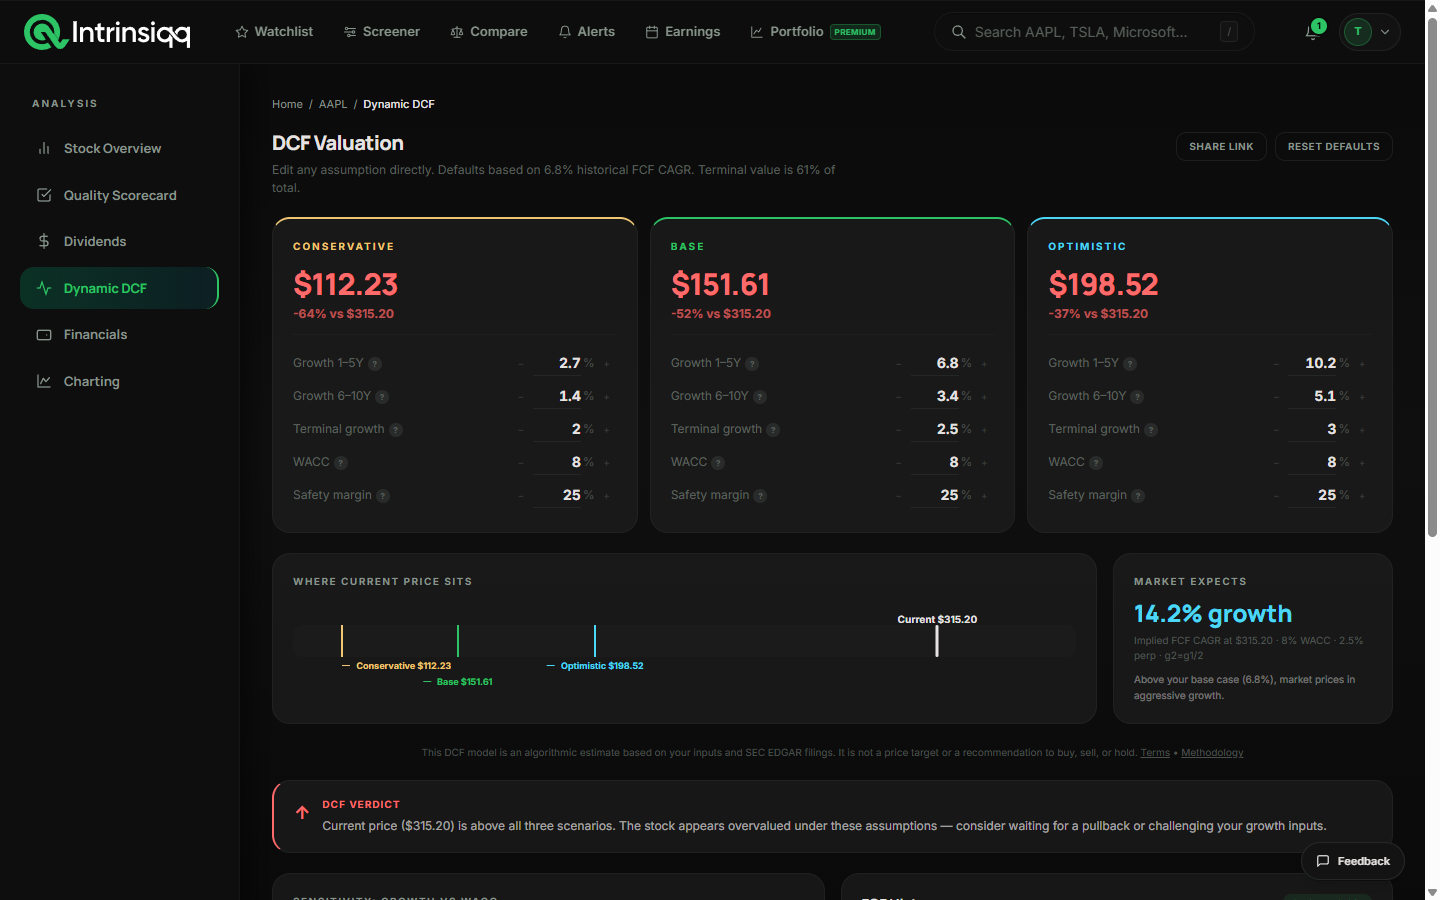
Open any stock on Intrinsiqq and the DCF model is already populated with the company's free cash flow, cash, debt, and share count from SEC EDGAR. You adjust the near-term growth, the fade rate, the discount rate, and terminal growth with sliders, and the implied intrinsic value and margin of safety update instantly across bull, base, and bear cases. Being straight about the pricing: you can read the base-case valuation and the margin of safety on any stock page without signing up, and editing the assumptions and running all three scenarios is part of the 14 days of full access every new account gets, no card required. After that, viewing stays free and editable scenarios are a paid feature. To sanity-check the starting point, you can also chart the company's free cash flow over a decade and overlay its historical P/FCF, so you can see whether the cash flow the model grows from is stable or lumpy before you trust the output.
Strengths
- +Financials auto-pulled from SEC filings, no manual entry
- +Adjustable sliders + bull/base/bear scenarios + margin of safety
- +Base-case valuation readable without signing up; 14 days of full access on a free account, no card
Limitations
- ×Editing the assumptions needs an account, and a paid plan once the trial ends
- ×Two-stage model rather than a fully custom multi-stage build
- ×Non-US fundamentals come from a data provider, not filings
- ×Not a spreadsheet you can restructure from scratch
Spreadsheet templates and add-ins
A DIY spreadsheet (or an add-in like Wisesheets that pulls data into Excel or Google Sheets) gives you total control over the model, at the cost of building and maintaining it yourself. Best for people who want a fully custom DCF and do not mind the work.
Strengths
- +Total control over the model structure
- +Reusable across many stocks once built
- +Free (a plain template) or low-cost (data add-ins)
Limitations
- ×Manual data entry unless you use a paid data add-in
- ×Easy to introduce errors; no guardrails
- ×Time-consuming to build and maintain
GuruFocus and Alpha Spread
GuruFocus offers a genuinely free DCF calculator that auto-populates financials, which puts it among the better free options. The catch is that its headline valuation, the proprietary GF Value, plus most of the historical context you would want around a DCF, sits behind a paid plan. Alpha Spread takes a similar shape: a usable free intrinsic-value view with the deeper scenario and relative-valuation work reserved for subscribers. Both are worth a look, and with both you should expect to hit a paywall at roughly the point the analysis gets interesting.
Strengths
- +Financials auto-populated, no manual entry
- +Established tools with long track records
- +Useful free tier for a single quick valuation
Limitations
- ×Headline valuation metrics are paywalled
- ×Free tiers limit how many companies you can value
- ×Assumptions are less transparent than a model you build yourself
Run a DCF on any stock, free
Financials pre-loaded from SEC filings. See the valuation without signing up, and get 14 days of adjustable assumptions and bull/base/bear scenarios on a free account.
Open AAPL's DCFWhy two people get different answers from the same DCF
This is the part most calculator comparisons skip, and it matters more than which tool you pick. A DCF's output is dominated by two inputs: the discount rate and the terminal growth rate. Small, entirely reasonable disagreements about either produce enormous differences in fair value, because the terminal value typically accounts for the majority of the total.
Take a company generating $100 of free cash flow, growing 8% for ten years, and work out the fair value across a range of assumptions that any two sensible analysts might choose. The figures below are illustrative arithmetic rather than a real company, which is exactly the point:
| Discount rate | Terminal growth 2% | Terminal growth 2.5% | Terminal growth 3% |
|---|---|---|---|
| 8% | $2,700 | $2,850 | $3,050 |
| 9% | $2,300 | $2,400 | $2,500 |
| 10% | $1,950 | $2,050 | $2,150 |
| 11% | $1,700 | $1,800 | $1,850 |
The spread from corner to corner is roughly 1.8x. Nobody in that table has done anything unreasonable: a discount rate between 8% and 11% and terminal growth between 2% and 3% are all defensible choices. That is why a single fair-value number from any calculator, including ours, should never be treated as a target price.
How to actually use a DCF
- Run it backwards. Instead of asking “what is this worth,” ask what growth rate the current share price already implies. If the market is pricing in 15% growth for a decade, you only need to judge whether that is plausible, which is a far easier question than forecasting.
- Check the starting cash flow is normal. A DCF grows from whatever free cash flow you feed it, so a one-off good or bad year propagates through the entire model. Look at a decade of free cash flow first and start from something representative.
- Always run three cases. A single point estimate hides the sensitivity shown above. Bull, base and bear tells you whether the investment case survives being wrong.
- Do not DCF everything. The model assumes reasonably predictable cash flows. For early-stage companies, deep cyclicals at a turning point, or banks (where the cash flow statement means something different), it produces numbers that look precise and mean very little.
How to choose
- Want a DCF with the financials already loaded and scenarios you can edit? Intrinsiqq, free to read and free to try in full for 14 days.
- Want total control over the model structure? A spreadsheet, with a data add-in if you value your time.
- Want a second opinion on one company? GuruFocus or Alpha Spread's free tier.
- Want to understand the method before trusting any tool? Start with our guide on how a DCF works.
One caveat about every DCF
A DCF is a model, not a fact. Its output is highly sensitive to the growth and discount-rate assumptions, so treat it as a way to test what the current price implies, not as a precise target. The value is in running the scenarios, not in trusting a single number. Used well, it is the best tool available for converting a vague sense that something is expensive into a specific, checkable claim about what the market is assuming. Used badly, it is a very elaborate way to justify a decision you had already made. For the full method, see our guide on how a DCF works, and for the concept underneath it, what intrinsic value actually means.